A useful report does not need thirty charts. Start with the decision you must make, then track a small group of measures that explain where the results come from—and whether they are valuable.
Start with the business question
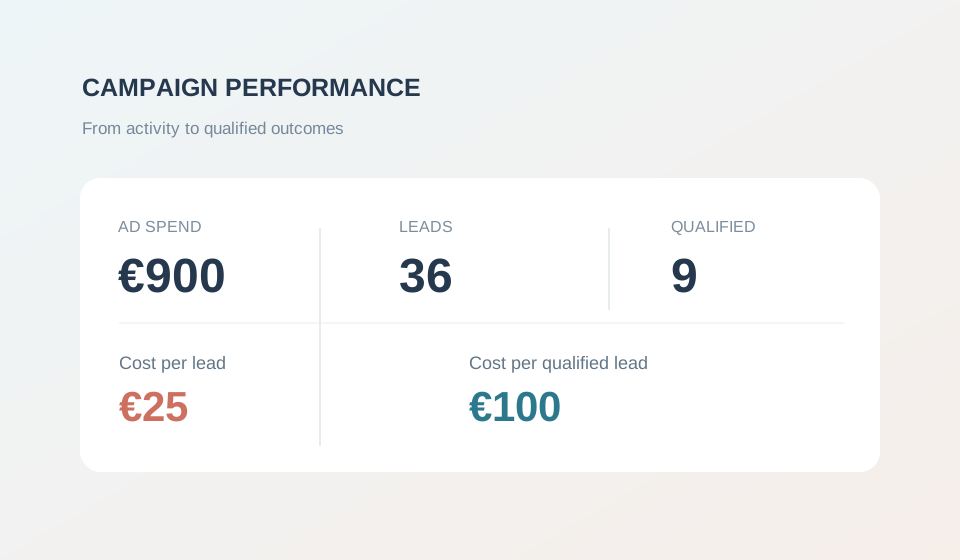
Suppose a business runs a small search campaign to generate consultation enquiries. The marketing report should answer three questions: How much did we spend? How many enquiries arrived? How many enquiries were genuinely suitable?
For this exercise, treat clicks, enquiries and qualified enquiries as separate numbers. A person who completes a form may still be outside the service area, looking for something unrelated or not ready to proceed.
Spend: €900 · Ad clicks: 1,200 · Form enquiries: 36 · Qualified enquiries: 9. The numbers are fictional; they demonstrate the calculation rather than an industry benchmark.
Try the live measurement calculator
Change the values below to test your own scenario. Calculations run locally in your browser; no data is sent or saved.
Enquiry rate = enquiries ÷ clicks. Cost per qualified enquiry = spend ÷ qualified enquiries.
These four measures explain different parts of the journey. They are not interchangeable: conversion rate measures frequency, while cost per qualified enquiry relates spending to useful outcomes.
Read the story, not only the numbers
| Metric | Question it answers | What to check next |
|---|---|---|
| Enquiry rate | How frequently do clicks become enquiries? | Landing-page intent and tracking |
| Cost per enquiry | How much spend produces one form enquiry? | Campaign efficiency and validity |
| Qualification rate | What share of enquiries are suitable? | Audience fit and lead criteria |
| Cost per qualified enquiry | How much spend produces one suitable lead? | Commercial value and capacity |
A lower cost per enquiry can hide worse quality. For example, if the campaign doubles its form submissions but the qualified count stays flat, the apparent gain may not help the business.
Do not mix definitions between months. If “qualified” changes from “within our service area” to “ready to buy within seven days,” annotate the change or the trend becomes misleading.
Build a short, repeatable review
Use the same date range and the same conversion definition each month. Record the channel, spend, clicks, enquiries, qualified leads and one action for the next period. Add notes about unusual promotions, tracking changes or seasonal demand.
“We generated nine qualified enquiries at €100 each. Next month we will focus on the search terms producing relevant leads, not just the ones producing the most clicks.”
Before trusting the report, verify that conversions fire only when the intended action happens. For a practical overview of what paid search is measuring, return to PPC Advertising.
Before you move on
- The business outcome and qualification criteria are written down
- Spend and conversion values refer to the same reporting period
- Tracking is tested before numbers are compared
- Definitions are consistent from period to period
- The report ends with one specific decision
Take one campaign report and replace a long list of metrics with a short decision-focused summary.